


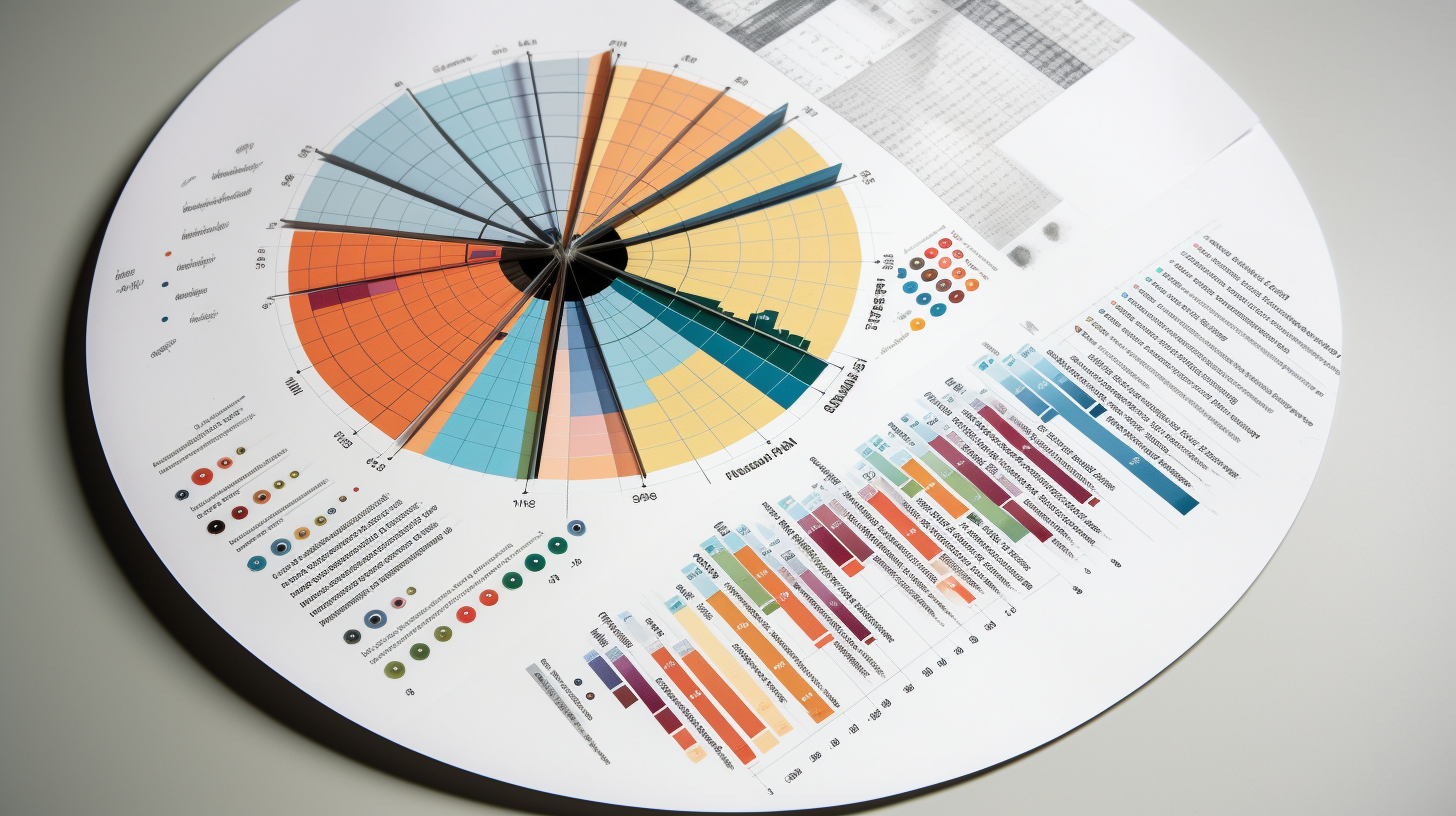
Graphing with MATLAB and R ?¡!?! Something Interesting…
Remember the MATLAB problem set 2 we did the other day?
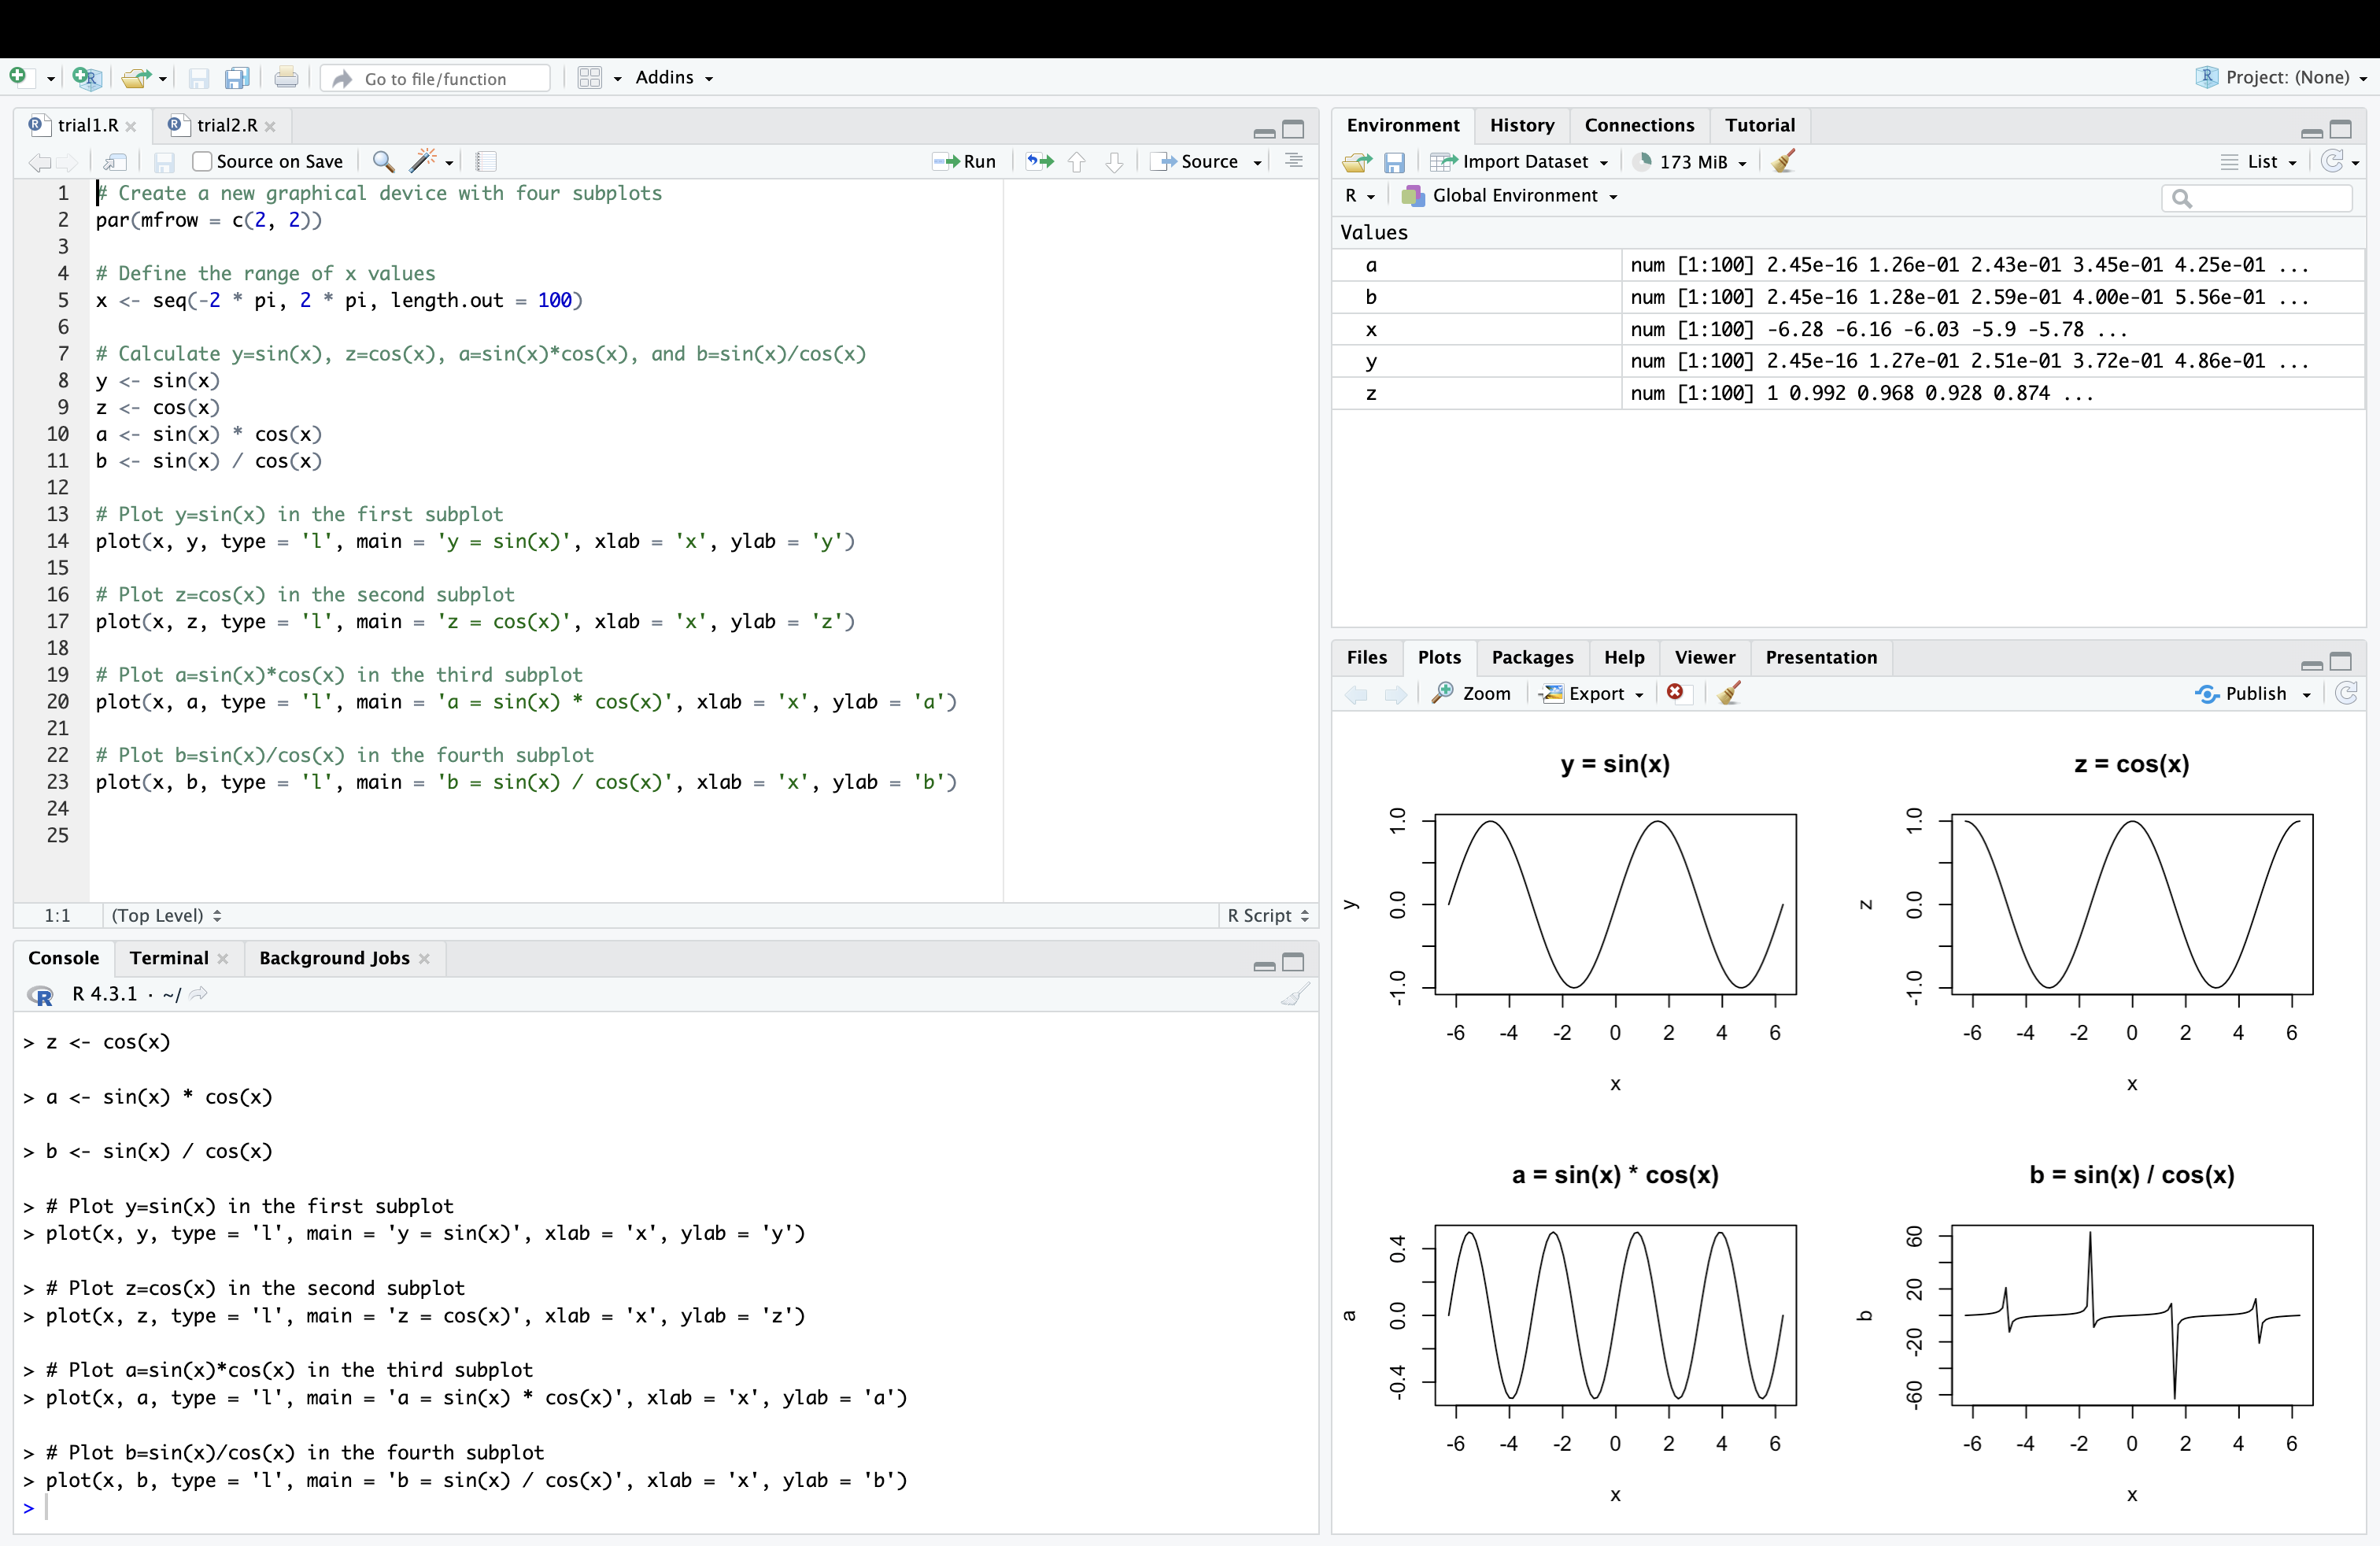
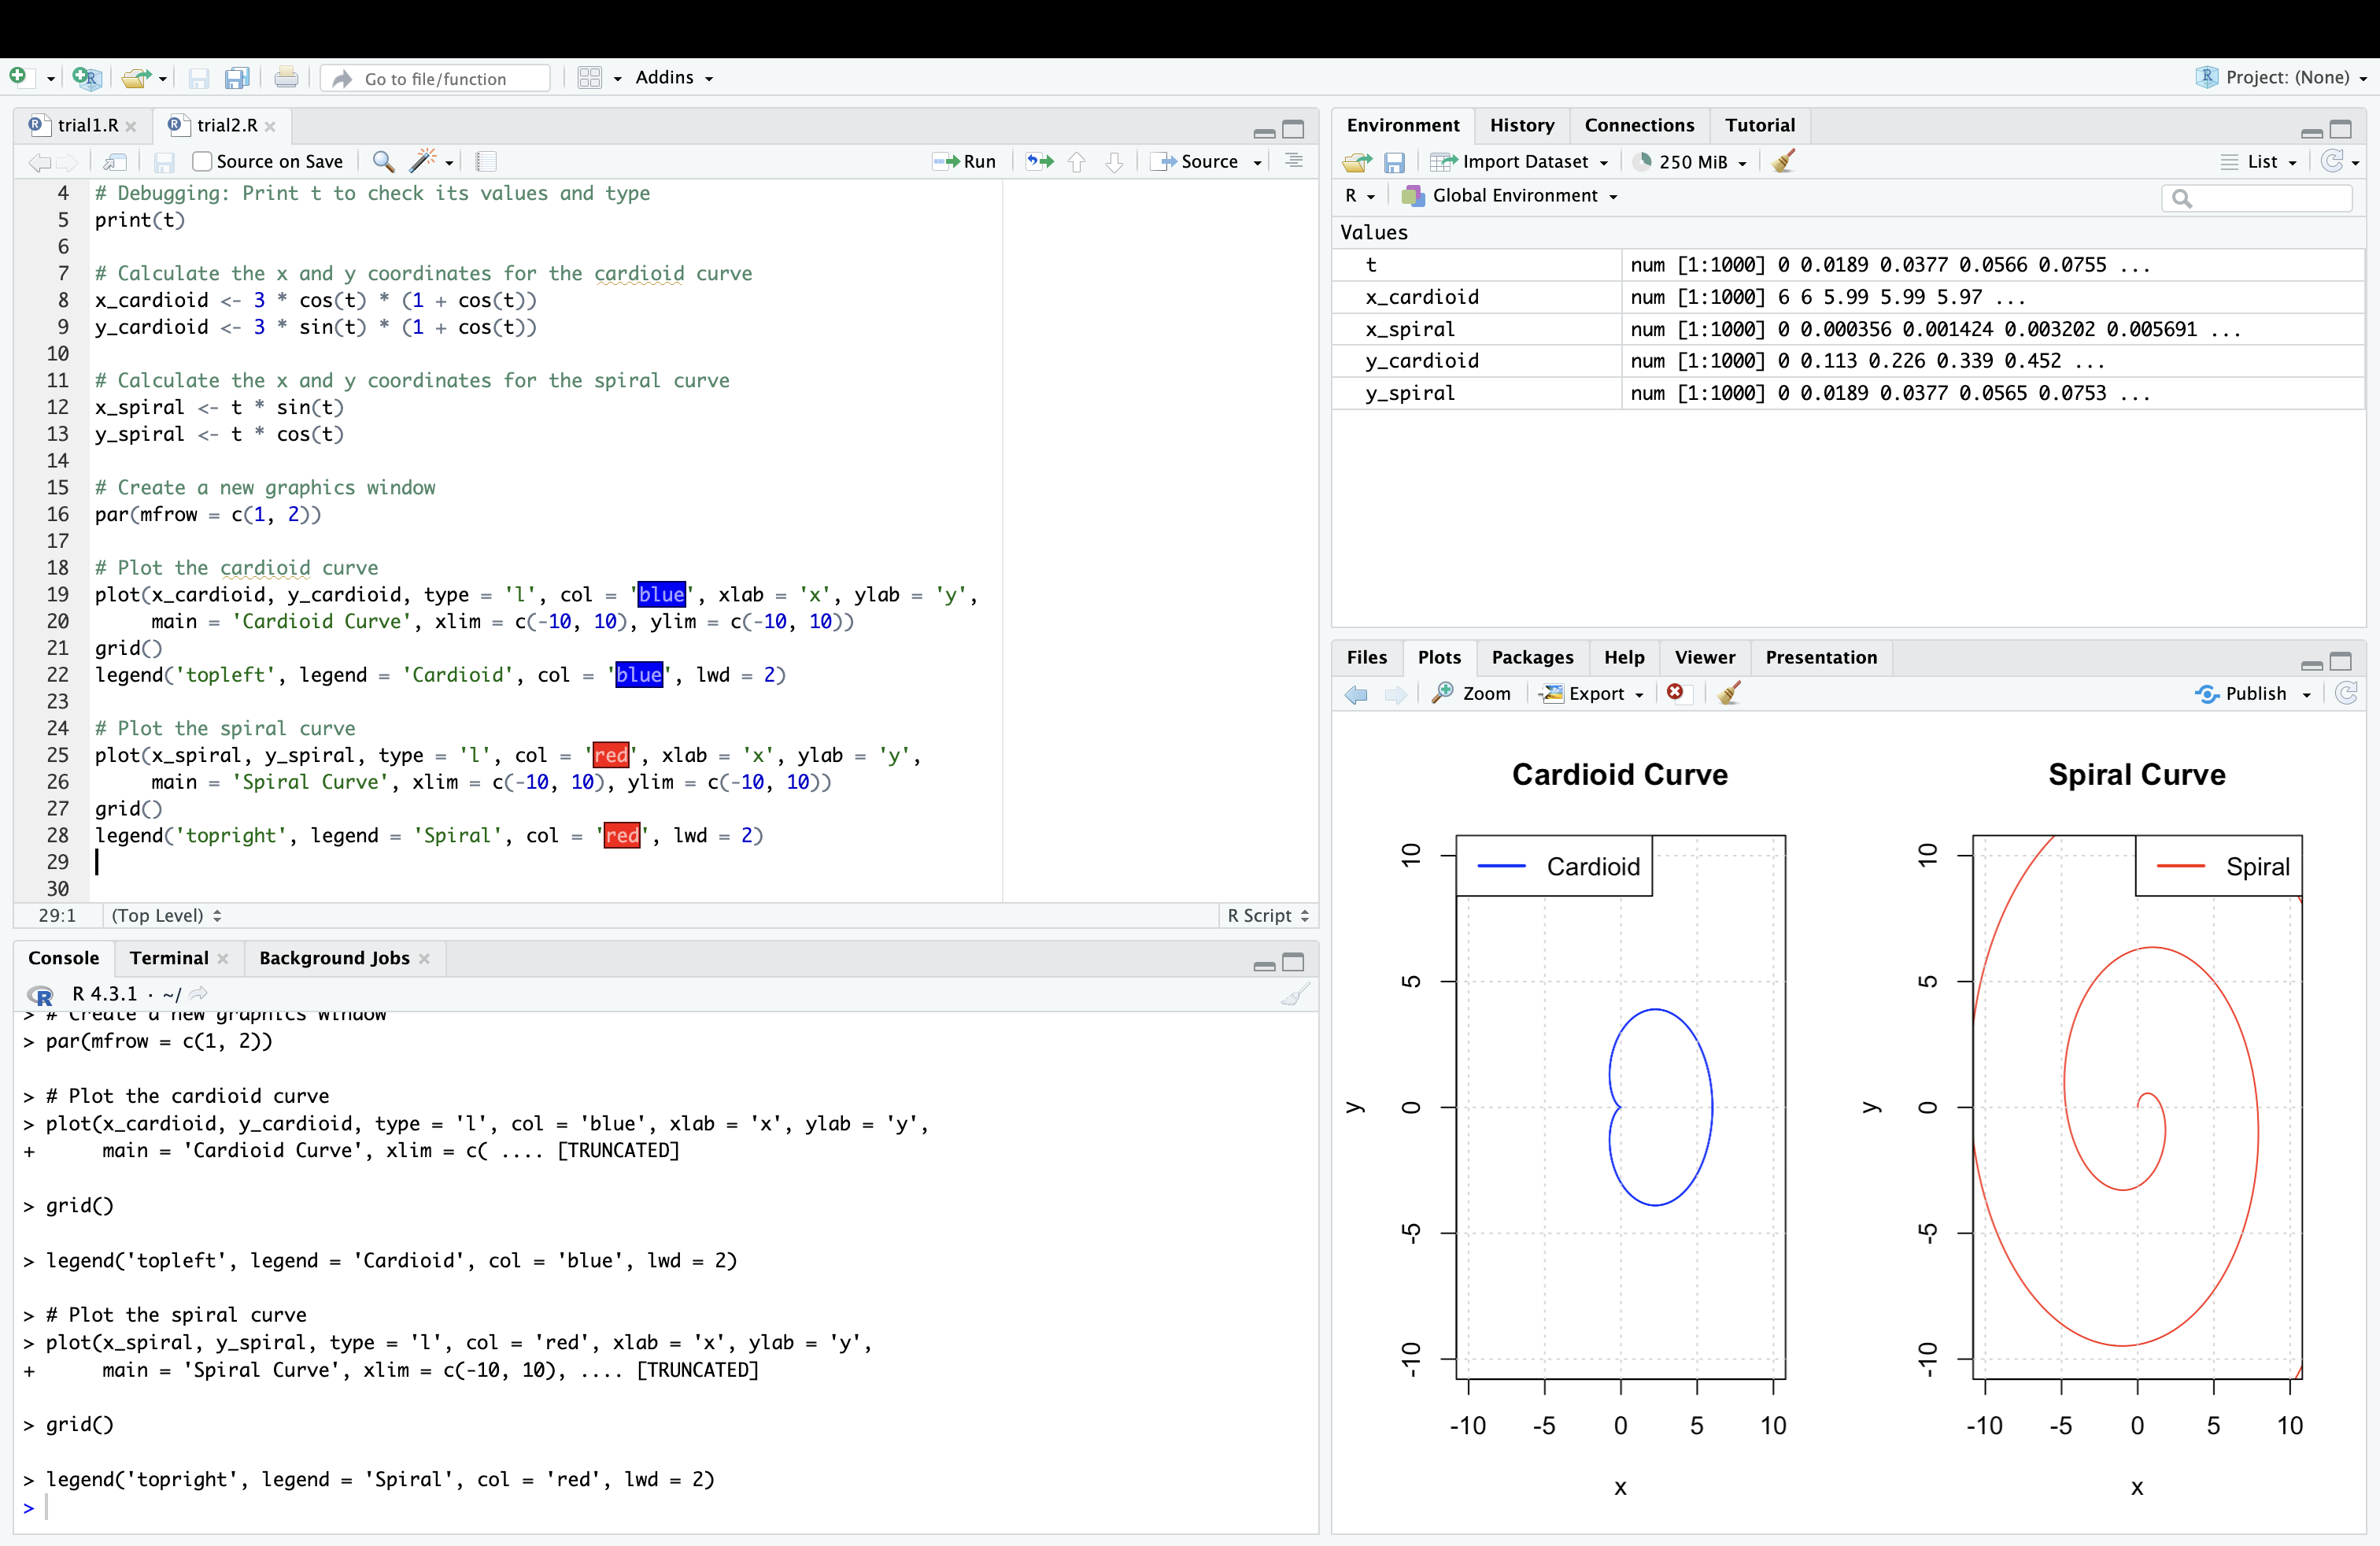
I tried drawing the same graphs in R and here are the results:
How did I did this when I have no idea about coding in R.
Well, we can use our AI assistant: ChatGPT
Tell ChatGPT the instructions and the language you will be using. Then, you will have the code!
If you want to try the R programs, you must install R and R Studio first: R Studio (click this link and then install)
Open R Studio and copy paste the code inside.
*Tips about running code in R Studio: R Studio only runs the program in its console, paste your code there or paste it in the workspace and use Cmd+shift+enter or Ctrl+shift+enter to executes the whole file.
Also if you want to clear your environment (which is the window containing variable names and values at the top right corner), use rm(list = ls()), but beware of there is no undo after this action.